SIWES Report for Science Laboratory Technology (SLT) Students: Full Sample and Guide
Read a full SIWES report sample for Science Laboratory Technology: test-by-test write-ups, chapters, table of contents and tips for lab placements.

If you are a Science Laboratory Technology (SLT) student, the hardest part of your SIWES report is Chapter Three. A report for a laboratory placement should not read like "I learned a lot in the lab". It should show what you tested, how you tested it, and what the result meant.
Below is a full SIWES report sample for an SLT student placed in a quality control laboratory, from the title page to the references. It uses a test-by-test layout in Chapter Three that works for most laboratory placements.
About this sample. The student (Amina Yusuf), company (Northwell Beverages Limited) and school (Sample Polytechnic) are fictional. Use the sample to see the structure, level of detail and tone. Your tasks, tests and equipment will be different, and your supervisor expects your own work, so do not copy it.
What makes an SLT report different
- Chapter Three is organised by test, not by week. Each test gets its own sub-section with the same six parts: aim, principle, specimen, materials and reagents, procedure, and results and interpretation.
- Quality control and safety are part of the story. Examiners in laboratory courses look for calibration, repeats, record keeping and safe waste handling, not only the tests themselves.
- Equipment matters. Say what each instrument does and how you used it.
- You describe what happened, not just the theory. The principle explains the test, but the procedure is written in the first person, as what you did.
Want a report like this from your own placement?
You can do it in a few minutes. Enter your details and a short summary of what you did, and the SIWES Report Generator writes the chapters in your school's format. For laboratory placements it produces the same test-by-test layout you see below. Read Chapters One and Two free before you decide to unlock the rest.
The notes behind this sample
This is the short summary the sample was written from. Notice how much of the report grows out of a single paragraph about real tasks.
I started with a safety induction on lab coat and glove use, handling chemicals, reading safety data sheets and disposing of waste correctly. I then collected samples of borehole water, treated water and finished bottled water and juice drinks from the production line, labelled them and recorded them in the sample register. In the chemistry section I calibrated the pH meter with buffer solutions and measured pH, measured conductivity and total dissolved solids, measured turbidity with a turbidity meter, determined total hardness by EDTA titration using Eriochrome Black T indicator, and determined chloride by the Mohr method using silver nitrate and potassium chromate. For juice drinks I measured Brix with a hand refractometer and titratable acidity by titration with sodium hydroxide. In the microbiology section I prepared nutrient agar and MacConkey agar, sterilised media and glassware in the autoclave, carried out the pour plate method for total viable count and the coliform test on water samples, incubated the plates and counted colonies. I also weighed reagents on the analytical balance, prepared standard solutions, washed and sterilised glassware, and recorded all results in the batch record sheets and in Excel for the supervisor to review before release.
Department of attachment: Quality Control Laboratory. Duration: 4 months (16 weeks). Equipment listed: pH meter, conductivity meter, turbidity meter, analytical balance, autoclave, incubator, hot air oven, hand refractometer, burettes, pipettes and volumetric flasks. Software: Microsoft Excel.
Full sample report
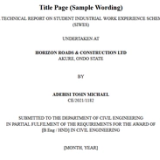
Cover page
TECHNICAL REPORT ON STUDENT INDUSTRIAL WORK EXPERIENCE SCHEME (SIWES)
AT
NORTHWELL BEVERAGES LIMITED
Agbara Industrial Estate, Ogun State
BY
AMINA YUSUF
ND/SLT/2024/0187
Department of Science Laboratory Technology
Sample Polytechnic
August 2026
Certification
This is to certify that Amina Yusuf with the Matriculation number ND/SLT/2024/0187 of the Science Laboratory Technology, Sample Polytechnic has completed her 4 months (16 weeks) Student Industrial Work Experience Scheme (SIWES) at Northwell Beverages Limited, Agbara Industrial Estate, Ogun State, from 4 May 2026 to 21 August 2026.
Institution Supervisor ______________________ Signature / Date ____________
SIWES Coordinator ______________________ Signature / Date ____________
Head of Department ______________________ Signature / Date ____________
Dedication
I dedicate this report to God Almighty, who gave me strength, good health and favour throughout my industrial training.
I also dedicate it to my parents and family for their constant prayers, encouragement and financial support, which kept me going during the programme.
Finally, I dedicate this work to the laboratory supervisor and the senior quality control analysts at Northwell Beverages Limited. Their patience and willingness to teach me made the training a truly valuable experience.
Acknowledgement
I sincerely thank my supervisor, Mr Tunde Bakare, for his guidance and supervision throughout my industrial training at Northwell Beverages Limited. His corrections and advice helped me understand the proper way to carry out laboratory procedures. I also thank the management and staff of Northwell Beverages Limited for giving me the opportunity to train in their quality control laboratory.
I am grateful to Sample Polytechnic and the Science Laboratory Technology department for preparing me for this training. I also appreciate the laboratory supervisor and the senior quality control analysts at Northwell Beverages Limited for their patience and support during the programme. Finally, I thank my family and friends for their encouragement throughout the four months.
Abstract
During my four-month industrial training, a total of sixteen weeks, I worked as a laboratory assistant at Northwell Beverages Limited in the Quality Control Laboratory. I moved between the chemistry bench and the microbiology bench, where I collected and registered samples of borehole water, treated water, finished bottled water and juice drinks, and carried out pH measurement, conductivity and total dissolved solids, turbidity, total hardness by EDTA titration and titratable acidity. On the microbiology bench I prepared and sterilised culture media and glassware, and performed the total viable count and coliform test on water samples. The tools I used most often were the pH meter, conductivity meter, turbidity meter, burette, analytical balance, autoclave and petri dishes, and I recorded all results in the batch record sheets and in Excel for the supervisor to review before any batch was released. The attachment connected my classroom learning in Science Laboratory Technology to real laboratory practice, since procedures I had only studied in theory, such as calibrating a pH meter and titrating against EDTA, were carried out under close supervision. I learned that a result is only useful when the sample is properly collected, labelled and traced back to its batch, and I gained confidence in handling equipment and keeping accurate records. Overall, the training gave me steady, hands-on exposure to quality control work and prepared me for a future role in a laboratory setting.
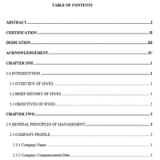
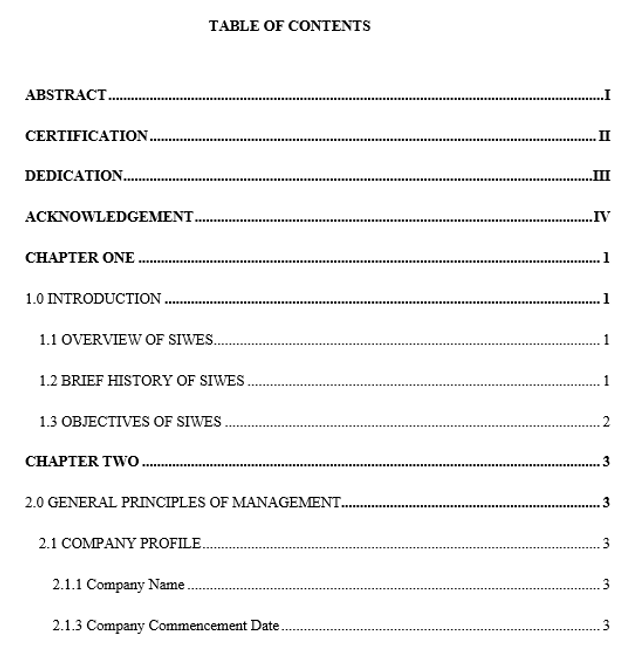
Table of contents
1Cover Page
2Certification
3Dedication
4Acknowledgement
5Abstract
6Table of Contents
7List of Figures
8
9Chapter One: Introduction
10    1.0 Introduction
11    1.1 Background of SIWES
12    1.2 Overview of the SIWES Programme
13    1.3 Aim and Objectives of SIWES
14    1.4 Significance of SIWES
15    1.5 Scope of This Report
16
17Chapter Two: Profile of the Organisation
18    2.0 Introduction
19    2.1 Brief History and Profile of the Organisation
20    2.2 Services and Operations
21    2.3 Vision and Mission
22    2.4 Organisational Structure
23    2.5 The Quality Control Laboratory
24
25Chapter Three: Experience Gained
26    3.0 Introduction
27    3.1 My Role and Supervision
28    3.2 Laboratory Tests Carried Out
29        3.2.1 Sample Collection and Registration (Sample Receiving Bench)
30        3.2.2 pH Measurement (Chemistry Bench)
31        3.2.3 Conductivity and Total Dissolved Solids (Chemistry Bench)
32        3.2.4 Turbidity Measurement (Chemistry Bench)
33        3.2.5 Total Hardness by EDTA Titration (Chemistry Bench)
34        3.2.6 Chloride Determination by the Mohr Method (Chemistry Bench)
35        3.2.7 Brix Measurement of Juice Drinks (Chemistry Bench)
36        3.2.8 Titratable Acidity of Juice Drinks (Chemistry Bench)
37        3.2.9 Media Preparation and Sterilisation (Microbiology Bench)
38        3.2.10 Total Viable Count and Coliform Test (Microbiology Bench)
39        3.2.11 Weighing of Reagents and Preparation of Standard Solutions (Chemistry Bench)
40    3.3 Quality Control and Result Reporting
41    3.4 Tools, Equipment and Software Used
42    3.5 Skills Gained
43    3.6 Relation of the Training to My Course of Study
44    3.7 Observations and Contributions
45    3.8 Challenges Encountered and How They Were Handled
46
47Chapter Four: Conclusion, Limitations and Recommendations
48    4.1 Summary
49    4.2 Conclusion
50    4.3 Limitations
51    4.4 Recommendations
52
53References
List of figures
1Figure 2.1: Organisational chart
2Figure 3.1: Laboratory bench or equipment used for these tests
3Figure 3.2: Analytical balance in use
4Figure 3.3: Autoclave and incubator section
5Figure 3.4: Titration set-up with burette and conical flask
6Figure 3.5: Hand refractometer in use
7Figure 3.6: Excel sheet used for recording results
Chapter One: Introduction
1.0 Introduction
This chapter gives the background of the Students' Industrial Work Experience Scheme (SIWES) and explains why the programme was set up. It also states the aims and objectives of the scheme and the significance of the training to students and to industry. The chapter closes with the scope of this report, which covers my four months of industrial training.
1.1 Background of SIWES
Before SIWES was introduced, many Nigerian graduates left school with good theoretical knowledge but very little practical skill. Employers complained that fresh graduates could not handle simple workplace tasks even though they had passed their courses. Industries also reported that graduates were unfamiliar with real working conditions, equipment and processes. This gap between the classroom and the workplace made it hard for graduates to settle into jobs quickly.
To solve this problem, the Industrial Training Fund (ITF) set up SIWES in 1973. The ITF funded the scheme in its early years, and later the National Universities Commission (NUC) and the National Board for Technical Education (NBTE) were brought in to help manage it. In 1984, the management of the scheme returned to the ITF, where it has remained. Today, SIWES runs in relevant programmes across Nigerian tertiary institutions, especially in science, engineering, technology, agriculture and management-related fields.
1.2 Overview of the SIWES Programme
SIWES places students in real organisations where the work relates to their course of study. The programme usually lasts between three and six months, depending on the institution and the course of study. In my case, the training lasted four months, which is sixteen weeks. During this period, students observe, learn and take part in the day-to-day work of the organisation. Each student keeps a logbook to record daily activities, and the industry-based supervisor signs the logbook at intervals. The ITF administers the scheme, while the NUC, NBTE and the National Commission for Colleges of Education (NCCE) coordinate it for the institutions under them. The institutions supervise the students, and the employers provide placements and day-to-day guidance.
1.3 Aim and Objectives of SIWES
The main aim of SIWES is to bridge the gap between theory and practice and to prepare students for work after graduation. It gives students early contact with the tools, equipment and working conditions of their field. This exposure helps them understand how the ideas they learn in class are used to solve real problems. The objectives of the scheme are:
- To give students the opportunity to apply what they learn in the classroom to real work situations.
- To help students gain practical skills that cannot be fully taught in lectures and laboratories.
- To expose students to good work ethics such as punctuality, honesty and respect for supervision.
- To give students hands-on experience with modern equipment and processes used in their field.
- To prepare students for the transition from school to employment after graduation.
- To strengthen the link between tertiary institutions and industry so that training stays relevant to the needs of employers.
1.4 Significance of SIWES
SIWES gives students hands-on experience that the classroom alone cannot provide. Working in a real organisation helps students build confidence and understand how tasks are carried out from start to finish. The training also improves their chances of getting jobs, because employers prefer graduates who have some work experience. In addition, students learn soft skills such as teamwork, communication, time management and how to relate with colleagues and supervisors. The scheme also creates a link between schools and industry, since feedback from employers helps institutions adjust their training to fit the needs of the workplace.
For a Science Laboratory Technology student, practical training is very important. Laboratory work depends on careful handling of samples, instruments and chemicals, and these skills are best learned by doing them under supervision. SIWES gives the student a chance to see how a real laboratory is organised and how safety rules are followed in practice. It also helps the student connect the procedures taught in school to the expectations of an actual workplace. This early exposure reduces the shock that many graduates face when they enter employment for the first time.
1.5 Scope of This Report
This report covers my experience during the SIWES programme, which lasted four months. It starts with an overview of the scheme, then describes the host organisation where I was posted. The report also explains the work I did during the training, the tools and procedures I was exposed to, and the skills I gained. It ends with a summary, conclusion and recommendations based on my experience.
Chapter Two: Profile of the Organisation
2.0 Introduction
This chapter describes Northwell Beverages Limited, the organisation where I completed my SIWES training. It covers the company's background, the services it provides, and the way its operations are organised. The chapter also looks at the company's vision and mission, its organisational structure, and the Quality Control Laboratory where I was posted. Together, these sections give the context needed to understand the work I did during the attachment.
2.1 Brief History and Profile of the Organisation
Northwell Beverages Limited is a beverage manufacturing company located at Agbara Industrial Estate in Ogun State, Nigeria. The company operates in the food and beverage sector, producing drinks for sale to consumers and distributors. Its location within an industrial estate places it close to other manufacturing firms and gives it access to the roads and utilities that support production. The company runs a factory setup where raw materials are received, processed, packaged, and prepared for distribution.
The company has grown over the years from a small operation into a recognised beverage producer in the Agbara area. Growth in this kind of business usually comes from steady demand, improvements in production capacity, and a focus on product quality. Northwell Beverages Limited has expanded its operations gradually, adding more production capacity and staff as demand for its products increased. This growth is reflected in the way the company now runs separate functions for production, quality control, storage, and administration.
2.2 Services and Operations
Northwell Beverages Limited produces and packages beverages for sale to consumers and business buyers. Its main operations cover the full process of turning raw materials into finished drinks, from receiving and preparing ingredients to filling, sealing, and labelling containers. The company also handles storage and dispatch so that products reach the market in good condition. These activities are carried out under conditions that meet the standards expected in food and beverage manufacturing.
The day-to-day work of the company is built around meeting customer demand while keeping products safe and consistent. Production runs are planned so that the factory can meet orders without delays, and each batch is checked before it leaves the premises. Distributors and retailers depend on the company for regular supply, so the operations are organised to avoid shortages. The company also provides employment for people in and around Agbara Industrial Estate, which adds to its role in the local community.
2.3 Vision and Mission
An official vision statement was not available during my training period. From what I observed, the company focuses on steady growth and on maintaining a strong position in the beverage market over the long term. This focus showed in the way production and quality targets were set and followed up.
An official mission statement was also not available. The company's observable purpose is to produce beverages that meet acceptable standards and to supply them reliably to its customers. This purpose guided the daily decisions I saw in the areas where I worked.
2.4 Organisational Structure
Northwell Beverages Limited follows a clear reporting structure that starts with top management. The management team is responsible for major decisions, including production targets, finances, and overall direction of the company. Below management are heads of department, who oversee the daily running of their sections and report upward on progress and problems. Supervisors work directly with staff on the factory floor and in supporting units, making sure tasks are carried out as planned.
Departments in the company depend on one another to keep operations moving. Production relies on raw materials and equipment, quality control checks output before release, and stores and dispatch handle what has been approved. When an issue comes up in one section, it is reported to the head of that department, who then works with other departments to resolve it. This arrangement keeps communication open and helps the company respond quickly when problems arise.
[Organisational chart goes here]
Figure 2.1: Organisational chart
Figure 2.1 shows the organisational structure of the company.
2.5 The Quality Control Laboratory
The Quality Control Laboratory is the unit where I was posted during my industrial training. It is responsible for testing raw materials, production samples, and finished products to confirm they meet the required standards. Staff in the laboratory carry out physical, chemical, and microbiological checks on samples taken at different stages of production. Results from these tests are recorded and passed on to the relevant departments for action.
The laboratory supports the rest of the company by making sure that only products that pass the required checks move forward. When a sample fails a test, the laboratory reports the result so that the cause can be investigated and corrected. This helps the company protect its reputation and avoid sending poor quality products to the market. The unit works closely with production and stores, since decisions on materials and finished goods depend on laboratory results.
Chapter Three: Experience Gained
3.0 Introduction
My four months of industrial training, a total of sixteen weeks, were spent at Northwell Beverages Limited in the Quality Control Laboratory. The laboratory handles the routine testing of water and beverage products at different stages of production, from raw borehole water to the finished bottled water and juice drinks. This chapter describes the work I did during the attachment, the skills I gained from each task and the challenges I faced along the way. I have arranged the account according to the units and benches where the work was carried out.
3.1 My Role and Supervision
I worked as a laboratory assistant attached to the Quality Control Laboratory, moving between the chemistry bench and the microbiology bench as the day's schedule required. Work was assigned to me each morning by the laboratory supervisor, who matched tasks to the production schedule so that samples were tested before products were released. Every test I carried out was done under the close supervision of a laboratory scientist, who checked my technique, my readings and my calculations before anything was entered into the records. I recorded all results in the batch record sheets and also entered them in Excel, and the supervisor reviewed these entries before any batch was cleared for release. Whenever my results looked unusual, I repeated the test and reported the repeat to the supervisor before recording a final value.
3.2 Laboratory Tests Carried Out
3.2.1 Sample Collection and Registration (Sample Receiving Bench)
Aim: To obtain representative samples of water and beverage products at the correct stages of production and to keep a traceable record of each sample.
Principle: A sample is only useful if it represents the whole batch it was taken from, so collection points and volumes are chosen to reflect the true condition of the product. Each sample is given a unique identity through labelling, and this identity is tied to the batch number, time of collection and tests required. Proper registration allows any result to be traced back to the exact batch and production time.
Specimen: Borehole water, treated water, finished bottled water and finished juice drinks collected directly from the production line at the points designated by the supervisor.
Materials and reagents: Clean sample bottles and containers, labels, a permanent marker, a sample register and a cooler box for holding samples before testing.
Procedure:
- I collected the required sample bottles from the sample receiving bench and confirmed that they were clean and dry.
- I collected borehole water, treated water and finished bottled water from the designated taps and line points, filling each bottle to the required level without leaving headspace that could affect the sample.
- I collected finished juice drink samples from the production line after the filling stage, using the containers provided for that purpose.
- I labelled each sample immediately with the product name, batch number, collection point, date and time.
- I entered each sample into the sample register, recording the same details plus the tests requested by the supervisor.
- I transported the samples to the laboratory benches where the required tests were to be done, keeping them in the cooler box where necessary.
- I handed over the register entries to the supervisor so the day's testing schedule could be confirmed.
Results and interpretation: The samples I collected formed the basis of all the tests described in this chapter. A correctly labelled and registered sample could be traced back to its batch at any time, which is the first requirement for releasing or rejecting a product. If a sample was wrongly labelled or the register entry was incomplete, the result could not be used for release, so I treated this step as seriously as the tests themselves.
3.2.2 pH Measurement (Chemistry Bench)
Aim: To measure the acidity or alkalinity of water and beverage samples, since pH affects taste, product stability and the effectiveness of treatment and cleaning.
Principle: A pH meter measures the potential difference between a glass electrode and a reference electrode when both are dipped in the sample. This potential difference is proportional to the hydrogen ion activity of the solution. Because the electrode response drifts with use, the meter must be calibrated with buffer solutions of known pH before any measurement.
Specimen: Borehole water, treated water, finished bottled water and juice drink samples collected from the production line.
Materials and reagents: pH meter, pH 4, pH 7 and pH 10 buffer solutions, distilled water, beakers, tissue paper and a magnetic stirrer where required.
Procedure:
- I switched on the pH meter and allowed it to warm up and stabilise.
- I rinsed the electrode with distilled water and blotted it gently with tissue paper.
- I calibrated the meter using the buffer solutions, starting with pH 7 and then the buffer closest to the expected sample pH, following the meter's calibration mode.
- I poured the sample into a clean beaker to a level that covered the electrode bulb.
- I dipped the electrode into the sample and stirred gently, then waited for the reading to stabilise.
- I recorded the pH value and the temperature shown by the meter.
- I rinsed the electrode with distilled water between samples and stored it in the storage solution after use.
Results and interpretation: The pH reading was compared with the specification for that product type. Water samples were expected to fall within the neutral range set by the laboratory, while juice drinks had their own specification range because their natural acidity is part of the product. A reading outside the specification meant the batch was held for investigation, and the sample was retested to confirm the value before any decision was taken.
3.2.3 Conductivity and Total Dissolved Solids (Chemistry Bench)
Aim: To measure the ability of the water to carry an electrical current and to estimate the total dissolved solids, which together indicate the level of dissolved mineral salts in the water.
Principle: Dissolved ions in water allow it to conduct electricity, so conductivity rises as the concentration of dissolved salts increases. The conductivity meter applies a voltage across two electrodes and measures the resulting current, which is converted to a conductivity value. Total dissolved solids are estimated from the conductivity reading using the meter's conversion factor.
Specimen: Borehole water, treated water and finished bottled water samples.
Materials and reagents: Conductivity meter with TDS function, standard conductivity solution for calibration, distilled water, beakers and tissue paper.
Procedure:
- I rinsed the conductivity cell with distilled water and blotted it dry.
- I calibrated the meter using the standard conductivity solution supplied for that purpose.
- I poured the sample into a clean beaker, making sure the cell would be fully immersed.
- I dipped the cell into the sample and moved it gently to remove air bubbles trapped between the electrodes.
- I waited for the reading to stabilise and recorded the conductivity value.
- I switched the meter to TDS mode and recorded the total dissolved solids reading for the same sample.
- I rinsed the cell with distilled water between samples and after the last reading.
Results and interpretation: The conductivity and TDS values were compared with the limits set for each water type. Treated water was expected to show lower values than raw borehole water because treatment removes a good part of the dissolved salts. A high reading suggested that the treatment process was not working as expected, and the supervisor was informed so that the treatment unit could be checked.
3.2.4 Turbidity Measurement (Chemistry Bench)
Aim: To measure the cloudiness of the water, which shows the level of suspended particles left after treatment.
Principle: A turbidity meter passes light through the sample and measures the light scattered by suspended particles at an angle to the light source. The amount of scattered light is proportional to the concentration of suspended particles, and the result is expressed in nephelometric turbidity units. Clear water scatters little light, while cloudy water scatters much more.
Specimen: Borehole water, treated water and finished bottled water samples.
Materials and reagents: Turbidity meter, standard turbidity solutions for calibration, sample cells, distilled water and lint-free tissue.
Procedure:
- I switched on the turbidity meter and allowed it to stabilise.
- I calibrated the meter using the standard turbidity solutions provided.
- I filled a clean sample cell with the sample, taking care not to touch the lower part of the cell where the light passes.
- I wiped the outside of the cell with lint-free tissue to remove fingerprints and water marks.
- I placed the cell in the meter, closed the lid and allowed the reading to settle.
- I recorded the turbidity value in nephelometric turbidity units.
- I rinsed the cell with distilled water between samples and repeated the reading where the value seemed inconsistent.
Results and interpretation: The turbidity value was compared with the limit set for the water type being tested. Treated and finished bottled water were expected to be clear, so any noticeable rise in turbidity pointed to a problem in filtration or in the lines. A high reading meant the batch was held and the sample retested, and the supervisor decided whether the batch could be released or had to be reworked.
3.2.5 Total Hardness by EDTA Titration (Chemistry Bench)
Aim: To determine the total hardness of the water, which is the combined concentration of calcium and magnesium ions.
Principle: EDTA forms stable complexes with metal ions, and it binds calcium and magnesium ions in a one to one ratio. Eriochrome Black T indicator forms a wine red complex with these ions at a pH of about 10, and the colour changes to blue when EDTA has taken up all the free ions. The volume of EDTA used is therefore proportional to the total hardness of the sample.
Specimen: Borehole water, treated water and finished bottled water samples.
Materials and reagents: Burette and stand, conical flasks, pipette, measuring cylinder, 0.01 M EDTA solution, ammonia buffer solution of pH 10, Eriochrome Black T indicator and distilled water.
Procedure:
- I rinsed the burette with distilled water and then with a small volume of the EDTA solution, and filled it to the zero mark.
- I pipetted a measured volume of the sample into a clean conical flask.
- I added the ammonia buffer solution to bring the sample to about pH 10.
- I added two to three drops of Eriochrome Black T indicator and swirled the flask, which turned the solution wine red.
- I titrated against the EDTA solution while swirling continuously, watching for the colour change.
- I stopped at the point where the last drop of EDTA turned the solution from wine red to a clear blue, and recorded the titre volume.
- I repeated the titration to obtain a concordant titre and calculated the total hardness from the average volume.
Results and interpretation: Total hardness was calculated from the volume of EDTA used and expressed as milligrams per litre of calcium carbonate. A low titre meant soft water, while a high titre meant hard water with a high level of dissolved calcium and magnesium salts. The result was compared with the specification for the water type, and values above the limit were reported to the supervisor because hardness affects taste and can cause scaling in the treatment equipment.
3.2.6 Chloride Determination by the Mohr Method (Chemistry Bench)
Aim: To determine the chloride content of the water samples.
Principle: In the Mohr method, silver nitrate is added to a neutral or slightly alkaline sample containing chloride ions. Silver ions first precipitate as white silver chloride, and once all the chloride has reacted, the excess silver ions react with potassium chromate indicator to form a red silver chromate end point. The volume of silver nitrate used is proportional to the chloride concentration.
Specimen: Borehole water, treated water and finished bottled water samples.
Materials and reagents: Burette and stand, conical flasks, pipette, 0.02 M silver nitrate solution, potassium chromate indicator and distilled water.
Procedure:
- I rinsed and filled the burette with the silver nitrate solution and set it to the zero mark.
- I pipetted a measured volume of the sample into a clean conical flask.
- I added a few drops of potassium chromate indicator, which gave the sample a yellow colour.
- I titrated against the silver nitrate solution while swirling the flask continuously.
- I watched for the first permanent appearance of a reddish brown colour, which marked the end point.
- I recorded the titre volume and repeated the titration for a concordant result.
- I calculated the chloride concentration from the average titre.
Results and interpretation: The chloride content was calculated from the volume of silver nitrate used and reported in milligrams per litre. A low chloride level is normal for most drinking water, while a high level may point to contamination or to a problem in the treatment process. The result was compared with the specification and any value above the limit was reported to the supervisor for action.
3.2.7 Brix Measurement of Juice Drinks (Chemistry Bench)
Aim: To measure the sugar content of the juice drinks, which controls sweetness and confirms that the product meets its formulation.
Principle: A hand refractometer measures the refractive index of a liquid, which rises as the concentration of dissolved solids, mainly sugars, increases. The instrument is graduated in degrees Brix, where one degree Brix represents one gram of sucrose in one hundred grams of solution. Because the reading depends on temperature, the value is corrected to the reference temperature of the instrument.
Specimen: Finished juice drink samples collected from the production line.
Materials and reagents: Hand refractometer, distilled water, dropper, tissue paper and a temperature reading from the sample.
Procedure:
- I cleaned the prism of the refractometer with distilled water and wiped it dry with tissue paper.
- I calibrated the instrument with distilled water, which should read zero degrees Brix.
- I placed two to three drops of the juice sample on the prism using a clean dropper.
- I closed the cover plate gently and held the instrument up to the light.
- I looked through the eyepiece and read the point where the light and dark fields met on the scale.
- I recorded the Brix value and the sample temperature, then applied the temperature correction where needed.
- I rinsed and dried the prism between samples and after the final reading.
Results and interpretation: The Brix value was compared with the formulation specification for that juice drink. A reading within the range confirmed that the sugar level was as expected, while a low or high reading showed a problem in the mixing stage. Any batch outside the specification was held and reported to the supervisor before release.
3.2.8 Titratable Acidity of Juice Drinks (Chemistry Bench)
Aim: To determine the total acid content of the juice drinks, which affects taste, shelf life and product consistency.
Principle: The acids in the juice are neutralised by a standard sodium hydroxide solution in a titration. Phenolphthalein indicator is colourless in the acidic sample and turns pink at the end point, when all the acid has been neutralised. The volume of sodium hydroxide used is proportional to the titratable acidity of the sample.
Specimen: Finished juice drink samples collected from the production line.
Materials and reagents: Burette and stand, conical flasks, pipette, 0.1 M sodium hydroxide solution, phenolphthalein indicator and distilled water.
Procedure:
- I rinsed and filled the burette with the sodium hydroxide solution and set it to the zero mark.
- I pipetted a measured volume of the juice sample into a clean conical flask.
- I added a few drops of phenolphthalein indicator to the sample.
- I titrated against the sodium hydroxide solution while swirling the flask continuously.
- I stopped at the first permanent pink colour that lasted for about thirty seconds.
- I recorded the titre volume and repeated the titration for a concordant result.
- I calculated the titratable acidity from the average titre and expressed it in the unit used by the laboratory.
Results and interpretation: The titratable acidity was compared with the specification for that juice drink. A value within range showed that the acid level was consistent with the formulation, while a value outside the range affected the taste and keeping quality of the product. Any batch outside the specification was held and the result reported to the supervisor.
3.2.9 Media Preparation and Sterilisation (Microbiology Bench)
Aim: To prepare and sterilise the culture media and glassware needed for microbiological testing, free from any contaminating organisms.
Principle: Culture media supply the nutrients that microorganisms need to grow, so they must contain the correct ingredients at the correct concentrations. Sterilisation by moist heat in an autoclave kills all microorganisms, including spores, by denaturing their proteins at high temperature and pressure. Glassware and media must be sterile before use, otherwise any growth seen on a plate cannot be attributed to the sample.
Specimen: Not applicable. This is a preparation step for the media and glassware used in the tests that follow.
Materials and reagents: Nutrient agar, MacConkey agar, distilled water, analytical balance, conical flasks, measuring cylinder, cotton wool, aluminium foil, autoclave, petri dishes and test tubes.
Procedure:
- I weighed the required quantity of the dehydrated medium on the analytical balance using a clean weighing boat.
- I dissolved the powder in the correct volume of distilled water in a conical flask and mixed it well.
- I plugged the flask with cotton wool, covered it with aluminium foil and labelled it with the medium name and date.
- I loaded the flask, glassware and petri dishes into the autoclave and closed the lid firmly.
- I set the autoclave to the required temperature and pressure and allowed it to run for the sterilisation time.
- I allowed the autoclave to cool and release pressure before opening the lid.
- I poured the molten agar into sterile petri dishes on a clean bench and allowed the plates to set before use.
Results and interpretation: Properly prepared plates were clear, free from bubbles and free from any growth before use. Any plate showing contamination before inoculation was discarded, since it could not give a valid result. Correct sterilisation was confirmed by the absence of growth on control plates and by following the autoclave temperature and pressure readings.
3.2.10 Total Viable Count and Coliform Test (Microbiology Bench)
Aim: To count the total number of viable bacteria in the water samples and to check for the presence of coliform organisms, which indicate faecal contamination.
Principle: In the pour plate method, a measured volume of the sample is mixed with molten agar and allowed to set, so any viable organism present grows into a visible colony. Each colony is assumed to have come from one organism, so the number of colonies shows the number of viable organisms in the sample. MacConkey agar selects for coliform organisms and shows lactose fermentation through a colour change, which helps confirm their presence.
Specimen: Borehole water, treated water and finished bottled water samples collected from the production line.
Materials and reagents: Nutrient agar plates, MacConkey agar plates, sterile pipettes, petri dishes, incubator, autoclave, distilled water and the sample bottles.
Procedure:
- I cleaned the work bench with disinfectant and arranged the sterile plates, pipettes and media within reach.
- I mixed each water sample gently by inverting the bottle several times to distribute any organisms evenly.
- I pipetted a measured volume of the sample into a sterile petri dish.
- I poured molten nutrient agar cooled to about 45 degrees Celsius over the sample and swirled the dish gently to mix.
- I repeated the same steps with MacConkey agar for the coliform test.
- I allowed the plates to set, inverted them and placed them in the incubator at the required temperature.
- I incubated the plates for the required period, then removed them and counted the colonies on each plate.
- I recorded the counts and calculated the total viable count per millilitre of sample.
Results and interpretation: The total viable count was reported as colony forming units per millilitre of sample. A low count within the specification showed that the water was fit for use, while a count above the limit showed a problem in treatment or in the filling line. On MacConkey agar, lactose fermenting coliforms appeared as pink to red colonies, and their presence in a treated or finished water sample was treated as a failure of the process. Any plate showing coliform growth was reported to the supervisor immediately so that the batch could be held.
3.2.11 Weighing of Reagents and Preparation of Standard Solutions (Chemistry Bench)
Aim: To prepare reagents and standard solutions at the exact concentrations required for the tests in the laboratory.
Principle: The accuracy of any titration depends on the accuracy of the standard solution used, so the mass of reagent and the final volume must both be measured carefully. The analytical balance measures mass to a high degree of precision, and the volumetric flask gives a fixed final volume. This combination allows a solution of known concentration to be prepared.
Specimen: Not applicable. This is a preparation step for the reagents used in the tests described above.
Materials and reagents: Analytical balance, weighing boat, spatula, volumetric flask, beaker, distilled water, funnel and the reagent being prepared.
Procedure:
- I cleaned the analytical balance pan and switched on the balance, allowing it to settle at zero.
- I placed a clean weighing boat on the pan and tared the balance to zero.
- I weighed out the required mass of reagent with a clean spatula, adding and removing small portions until the reading matched the target mass.
- I transferred the weighed reagent into a beaker and dissolved it in a small volume of distilled water.
- I transferred the solution into a volumetric flask through a funnel, rinsing the beaker into the flask to avoid loss.
- I made the solution up to the mark with distilled water, stoppered the flask and mixed it by inverting several times.
- I labelled the flask with the reagent name, concentration and date of preparation before use.
Results and interpretation: A correctly prepared solution matched the required concentration and gave consistent titration results. If the mass or final volume was wrong, the titre values would be wrong and every result based on that solution would be affected. For this reason I always recorded the mass weighed and the final volume, and the supervisor checked the label before the solution was used.
3.3 Quality Control and Result Reporting
Every result I generated was checked before it was recorded as final. For the plate based tests, I confirmed that the control plates showed no contamination before I trusted any count. I repeated any test that gave an unclear or unexpected reading, and I compared the repeat result with the first before deciding which value to report. This habit of checking and repeating kept me from recording a wrong value that could have led to a wrong release decision.
All readings were entered first in the laboratory register and the batch record sheets for that product, and then transferred into the Excel sheet used by the department. The supervisor reviewed the entries against the specification for each product before any batch was cleared, and I did not release any result on my own. Where a result fell outside the specification, the batch was held and the supervisor decided on the next step, which could be a repeat test or further investigation of the production line.
Safe handling of specimens and waste was part of the daily routine. Used plates, pipette tips and sample containers were placed in the designated waste containers and sterilised before disposal, and bench surfaces were cleaned with disinfectant after each session. I washed and sterilised glassware after use so that it was ready for the next day's work. These practices protected both the staff and the samples, and they are the same practices I expect to follow in any laboratory where I work.
[Your photo goes here]
Figure 3.1: Laboratory bench or equipment used for these tests
3.4 Tools, Equipment and Software Used
The pH meter was the instrument I used most often in the chemistry section. I calibrated it with buffer solutions before each set of readings, then measured the pH of borehole water, treated water and the finished products. Proper calibration mattered because a wrong reading would have affected the release decision for that batch.
The conductivity meter helped me measure the conductivity and total dissolved solids of the water samples. I rinsed the probe with distilled water between readings to avoid carrying one sample into the next. The turbidity meter was used in the same way to check how clear the water was, since turbidity gives a quick idea of suspended particles in the sample.
The analytical balance was used for weighing reagents when I prepared standard solutions. I always checked that the balance was level and reading zero before placing anything on the pan. This mattered during titration work, because the strength of the standard solution depended on accurate weighing.
[Your photo goes here]
Figure 3.2: Analytical balance in use
The autoclave was used to sterilise media and glassware before microbiological work. I loaded the items, ran the cycle and allowed the pressure to drop before opening the door. The incubator was where I kept the poured plates at the required temperature so that colonies could grow for counting.
[Your photo goes here]
Figure 3.3: Autoclave and incubator section
The hot air oven was used for drying and sterilising glassware that could take dry heat. Burettes, pipettes and volumetric flasks were the main glassware for the titration work and for preparing solutions. I rinsed the burette with the titrant before filling it, and I read the meniscus at eye level to avoid parallax error.
[Your photo goes here]
Figure 3.4: Titration set-up with burette and conical flask
The hand refractometer was used to measure Brix in the juice drinks. I placed a few drops of the sample on the prism, closed the cover and read the value against the light. I cleaned the prism with distilled water after each reading so that one sample did not affect the next.
[Your photo goes here]
Figure 3.5: Hand refractometer in use
On the software side, I used Microsoft Excel to enter the results I had recorded in the batch record sheets. I arranged the readings in rows and columns so the supervisor could compare them with the specification limits before release. This made it easier to spot values that were close to the limit and needed a repeat test.
[Your photo goes here]
Figure 3.6: Excel sheet used for recording results
3.5 Skills Gained
Technical Skills
I gained practical skill in water and beverage analysis, which is the core of quality control work. I learned to calibrate a pH meter with buffer solutions and to take readings that can be trusted. I also learned to run titrations for total hardness, chloride and titratable acidity, and to calculate the final values from the titre volumes. These are hands-on skills that I could not have gained by only reading about them in class.
I also gained skill in microbiological techniques. I prepared nutrient agar and MacConkey agar, sterilised media and glassware in the autoclave, and carried out the pour plate method for total viable count and the coliform test. I learned to incubate plates at the correct temperature and to count colonies without confusing them with particles in the agar. Preparing standard solutions and weighing reagents on the analytical balance also improved my accuracy and patience in the laboratory.
Soft Skills
The training improved my teamwork and communication. I worked with the analysts on duty, and we shared tasks like sample collection, media preparation and glassware washing so that the work moved faster. I learned to report results clearly to my supervisor and to ask questions when a reading looked unusual instead of guessing. Time management also improved because samples had to be collected, tested and recorded within the production schedule, and any delay could hold up a batch release. I also learned to solve small problems, such as repeating a test when a reading fell outside the expected range.
3.6 Relation of the Training to My Course of Study
The training connected directly to Analytical Chemistry, which I have studied in Science Laboratory Technology. The titration work for total hardness, chloride and titratable acidity was a practical version of the volumetric analysis we did in class. Calibrating the pH meter and using the conductivity and turbidity meters also linked to Instrumental Analysis, where we learned the principles behind these instruments. In class I learned the theory and calculations; in the laboratory I learned how the same methods are applied to real samples under production pressure.
Microbiology also came alive during the attachment. Preparing nutrient agar and MacConkey agar, sterilising with the autoclave and carrying out the pour plate method matched the practical microbiology we were taught. The coliform test for water samples showed me how indicator organisms are used to judge safety, which we had only discussed in theory. Recording results in batch record sheets and Excel also connected to good laboratory practice and data handling, which are part of laboratory management. The training added the discipline of working to standard methods and specification limits, which the classroom alone could not give me.
3.7 Observations and Contributions
What stood out most was how strict real workplace practice is about records and procedure. In school, a wrong titration could simply be repeated and the exercise continued. At Northwell Beverages, every reading went into the batch record sheet and was reviewed before a product was released. I also noticed that calibration and cleaning were treated as part of the test, not as extra work. The pace was different too, because production did not wait for the laboratory. This showed me that quality control is a support function that keeps production safe and within specification.
My contribution was mainly in supporting the routine work of the laboratory under supervision. I collected and labelled samples, recorded them in the sample register and carried out the chemical and microbiological tests assigned to me. I also helped with weighing reagents, preparing standard solutions and washing and sterilising glassware, which reduced the load on the analysts. Entering results into Excel made it easier for the supervisor to review the data before release. These were supervised tasks, but they helped the department keep to its testing schedule.
3.8 Challenges Encountered and How They Were Handled
One challenge was getting consistent readings from the pH meter at the beginning. My first readings drifted because I did not allow the meter to stabilise fully after calibration. I raised this with the analyst on duty, who showed me how to calibrate with fresh buffer solutions and wait for the reading to settle before recording it. I made it a habit to rinse the electrode with distilled water between samples and to recalibrate when the readings looked doubtful. This taught me that calibration is not a one-off step but something to check throughout a batch of tests.
Another challenge was avoiding contamination during microbiological work. Preparing media and pouring plates required care, and I had to learn the correct way to handle sterile items. I followed the safety induction rules on lab coat and glove use, worked near the flame where required and kept plates covered when not in use. I also learned to sterilise glassware properly in the autoclave and to allow it to cool before use. This reduced the risk of false counts and taught me that patience and cleanliness matter as much as the test method itself.
Need Chapter Three for your own lab placement?
Tell the generator which tests you ran and which equipment you used, and it writes each one in this aim-to-results format, with your own steps and your own bench. Preview Chapters One and Two free.
Chapter Four: Conclusion, Limitations and Recommendations
4.1 Summary
My industrial training took place at Northwell Beverages Limited in the Quality Control Laboratory for a period of four months, which is sixteen weeks. I worked as a laboratory assistant and moved between the chemistry bench and the microbiology bench according to the day's schedule. The work covered the routine testing of borehole water, treated water, finished bottled water and finished juice drinks at different stages of production. Each morning the laboratory supervisor assigned tasks to me, and every test I carried out was done under the close supervision of a laboratory scientist.
The main tasks I handled included sample collection and registration, pH measurement, conductivity and total dissolved solids, turbidity, total hardness by EDTA titration and titratable acidity of juice drinks. On the microbiology bench I prepared and sterilised culture media and glassware, and I carried out the total viable count and coliform test on water samples. The tools I used most often were the pH meter, conductivity meter, turbidity meter, burette, analytical balance, autoclave and petri dishes. I recorded all my results in the batch record sheets and also entered them in Excel for the supervisor to review before any batch was released.
4.2 Conclusion
The four months I spent at Northwell Beverages Limited gave me a clear picture of how the tests I had only read about in class are actually carried out in a working laboratory. Calibrating a pH meter, titrating against EDTA and pouring agar plates are things I had studied in theory, but doing them under supervision showed me the care that each step requires. I learned that a result is only useful when the sample is properly collected, labelled and traced back to its batch. The training also taught me to repeat any test that gave an unusual reading before recording a final value, and to report every result to my supervisor.
I plan to use what I learned in my remaining coursework in Science Laboratory Technology, especially in analytical chemistry and microbiology practicals. The experience has made me more confident in handling laboratory equipment and in keeping accurate records. In the future I hope to work in quality control or a related laboratory role, and the routine of testing, recording and reporting that I practised here will be useful in that setting. Overall, the sixteen weeks gave me steady, hands-on exposure rather than a brief look at laboratory work.
4.3 Limitations
One limitation I faced was the irregular supply of reagents. Some reagents were sometimes in short supply, which meant that certain tests had to wait until fresh supplies arrived. This slowed down the day's testing schedule and, at times, delayed the release of results for some batches. I had to adjust by attending to the tests whose reagents were available while waiting for the others.
Power outages were another challenge during the attachment. The outages interrupted incubation, so the generator had to be switched on quickly to keep the incubator and other equipment running at the correct temperature. There was also a limit on what I could do on my own. As a student I could not release results by myself, so every reading and calculation had to be checked and approved by a laboratory scientist before it was entered as final. These limitations could be reduced in future placements if laboratories keep a buffer stock of reagents and maintain a standby power supply.
4.4 Recommendations
Based on my experience during the attachment, I make the following recommendations.
To the institution and the ITF:
- Strengthen the pre-placement briefing so students know what to expect in a working laboratory before they resume.
- Visit students on attachment at least once during the period to confirm that they are actually engaged in relevant work.
- Encourage schools to align practical coursework more closely with the routine tests students meet in industry.
To the host organisation:
- Provide a short laboratory orientation for every student at the start of the attachment.
- Set aside time for students to practise each test under supervision before they handle samples alone.
- Keep a buffer stock of reagents and maintain a standby power supply to reduce interruptions to testing.
To future SIWES students:
- Ask questions early and take notes on every procedure you are shown.
- Treat sample labelling and record keeping as seriously as the tests themselves.
- Report any unusual reading to your supervisor at once instead of recording it as final.
References
- Industrial Training Fund. (n.d.). Students Industrial Work Experience Scheme (SIWES). https://itf.gov.ng/pdf/SIWES%20Work.pdf
- Monoed. (2025, October 4). The history of SIWES in NigeriEverything you need to know. https://monoed.africa/blog/history-of-siwes-in-nigeria
- World Health Organization. (2020). Laboratory biosafety manual (4th ed.). https://www.who.int/publications/i/item/9789240011311
- Microsoft. (n.d.). Microsoft 365 documentation. https://support.microsoft.com/microsoft-365
- Ph Meter. (n.d.). In Wikipedia. https://en.wikipedia.org/w/index.php?title=Ph_Meter
- Conductivity Meter. (n.d.). In Wikipedia. https://en.wikipedia.org/w/index.php?title=Conductivity_Meter
- Turbidity Meter. (n.d.). In Wikipedia. https://en.wikipedia.org/w/index.php?title=Turbidity_Meter
- Kolb, D. A. (2015). Experiential learning: Experience as the source of learning and development (2nd ed.). Pearson Education.
How to adapt this sample to your own placement
Your lab may not be a beverage laboratory. The structure stays the same; the tests change.
- Hospital or clinical laboratory: write one sub-section for each test you ran, such as blood film, malaria parasite test, packed cell volume, blood grouping, urinalysis or culture and sensitivity. Keep patient details out of your report. SIWES report for Microbiology students
- Quality control or food and beverage laboratory: use tests like pH, titratable acidity, moisture content, microbial counts or proximate analysis, in the same format as above.
- Water or environmental laboratory: think of conductivity, turbidity, hardness, chloride, dissolved oxygen and microbial counts.
- Research or industrial laboratory: describe the methods you used, the instruments you operated and the part you played in the experiment.
- Fewer tests than the sample? That is fine. Write fewer sub-sections but explain each test fully. Never add tests you did not do.
Tips for a strong SLT report
- Take notes at the bench. Write the test name, the date and the main steps while they are fresh. How to fill your SIWES logbook as an SLT student
- Use your own words for the principle. It should explain why the test works.
- Write the procedure as what you did, in order, in the past tense.
- Never invent results. If your supervisor gave you a reading, say what it meant. If not, describe how it is interpreted.
- Name the equipment and say what each instrument does.
- Include photos where you are allowed. Ask your supervisor first; some companies restrict photography in the laboratory.
- Record safety and quality control: calibration, repeat tests, labelling, waste disposal and PPE.
- Keep client or patient information out of the report.
- Check your school's format first. Some schools use five chapters instead of four.
Write yours the easy way
Writing a report like this by hand takes days. The SIWES Report Generator does the heavy lifting from your own notes.
- Matches your school's format, with four or five chapters.
- Test-by-test Chapter Three for laboratory placements.
- Choose which pages to include: certification, dedication, acknowledgement, abstract or Report Overview, table of contents and list of figures.
- Numbered figure captions ready for your photos.
- Print-ready Word or PDF file.
- Free preview of Chapters One and Two.
FAQs
How long is SIWES for Science Laboratory Technology students?
It depends on your school. Polytechnics and colleges usually run four months (16 weeks), and universities usually six months. Check your SIWES handbook.
What should I write in Chapter Three of my SIWES report as an SLT student?
The work you did in the laboratory. Write one sub-section per test, with its aim, principle, specimen, materials and reagents, procedure and how the result is interpreted. Add a section on quality control, safety and record keeping, and one on the equipment you used.
Do I have to describe every test I did?
Describe the main tests you carried out yourself. If you only observed a test, say so. Do not include tests you did not do.
Can I use this sample as my SIWES report?
No. The names, company and tests are fictional, and your supervisor expects your own experience. Use it for structure and level of detail, then write about your own placement.
Can I take photos in the laboratory for my report?
Ask your supervisor first. Many laboratories restrict photography. If you cannot take photos, leave out the photo placeholders or use a labelled diagram.
Does an SLT report use four or five chapters?
It depends on your school. Many use four chapters, while some use five. In a five-chapter format, the work done and the equipment and experience move into separate chapters.
How long should Chapter Three be for a laboratory placement?
Long enough to cover every main test you ran, each with its own sub-section. It is normally the longest chapter in the report.
Does the SIWES Report Generator work for laboratory courses?
Yes. When your placement is a laboratory, it writes Chapter Three test by test, using the tests and equipment you list. Check the result and add your own details before you submit.
About the Author
Mohammad-Jamiu B. Balogun, GMNSE
AI Security Researcher · Founder, MonoEd Africa
Mohammad-Jamiu is a First-Class Telecommunications Engineer and Best Graduating Student, BUK '24, and an AI security researcher. He founded MonoEd Africa to give Nigerian students AI-powered academic tools — from SIWES logbooks to final year projects. His work has reached over 10,000 students across Nigeria.